Why do I need Machine Monitoring in my Factory?
With competition growing and margins tightening, machine monitoring has become an important component in the process of creating a streamlined, profitable manufacturing operation.
What is Machine Monitoring?
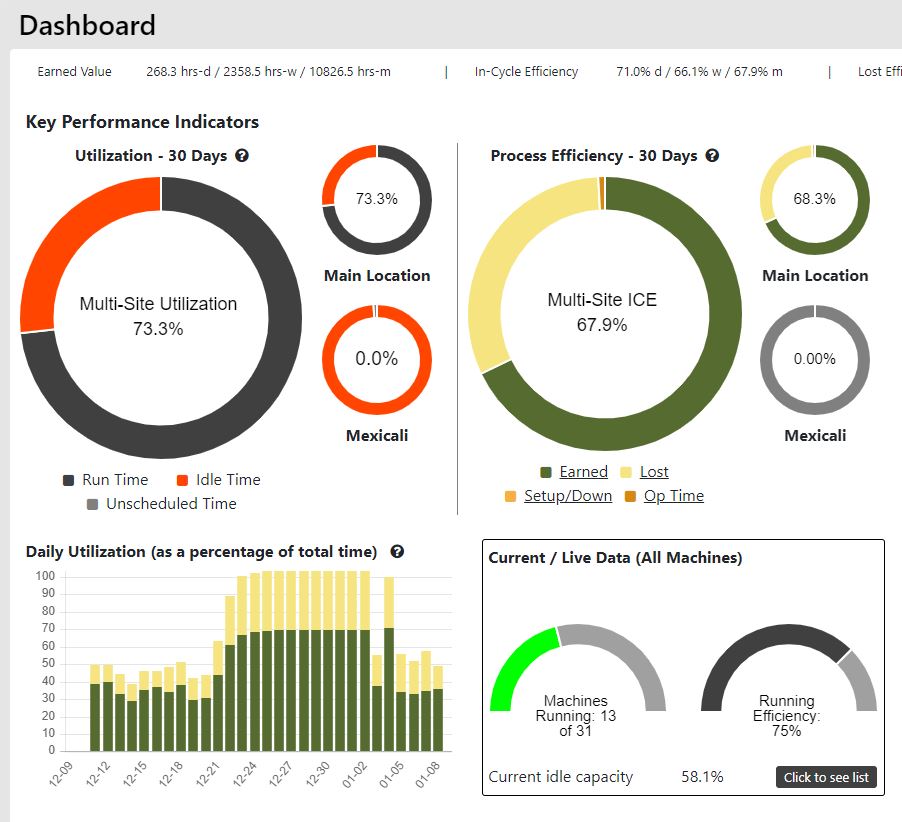
Machine monitoring provides real-time and historical data of the utilization of shop equipment. Monitoring may record multiple factors including:
Additionally, machine monitoring may also provide:
- Record stoppage or interrupt codes
- Alerts to key personnel for preset conditions
- Scheduled AM and PM based on machine usage
- Sending of automated reports
- Help with calculate OEE
What are the Primary Benefits to Machine Monitoring?
Machine monitoring is possibly the best way to optimize the manufacturing process, exposing bottlenecks / inefficiencies and providing key insight. Benefits include:
- Provide true utilization metrics, allowing management to make informed decisions on
- In the current setup, do we have the ability to take on additional work?
- Do I need to add an additional shift or maximize utilization?
- Do I need to add machines to the operation or maximize utilization?
- Discover most common reasons of stoppage
- Find the root cause for common stoppage are remove it
- Manage operations in real time without constantly walking the floor
- Provide accurate forecasts of project completion
- Ability to show a client where their contract fits into your process without guessing or requiring overtime.
- Accurately assess operator productivity
- Many systems allow operator and manager comments to put data in context


Other benefits may include:
- Operator Autonomous Maintenance prompting and tracking
- Routine maintenance (PM) scheduling
- Integration with ERP
- Event driven, live email and text message alerts
- Accurate list of operations and number of operations completed
- Automated interrupt code entry
How is the monitoring achieved?
Extracting data from a machine can be achieved in several ways which include a direct data connection, I/O connectivity, and simple on/off monitoring.
Data Connections
By far, the best way to collect data from a machine on the shop floor is by making a data connection. This not only supplies the most accurate data, but also offers the most information and insight into what that machine is doing.
Fanuc
Fanuc controls model 15i or greater along with the 0i are likely equipped with or have the ability to install and utilize their FOCAS connection. The FOCAS connection can provide an extensive list of current data metrics.
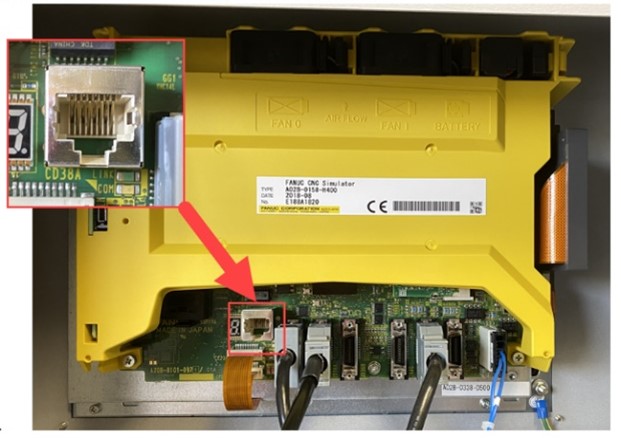
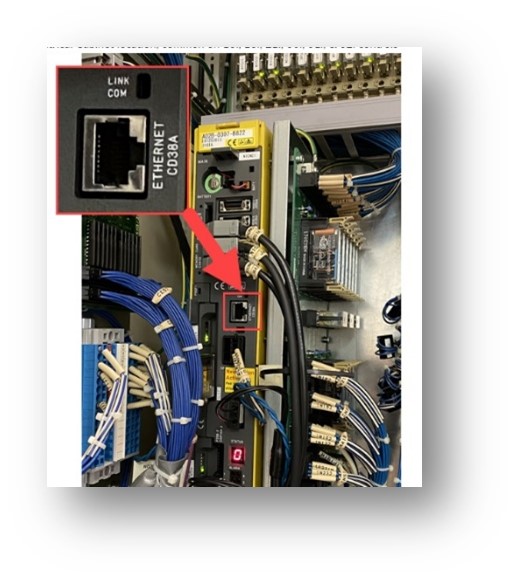
FOCAS requires a second ethernet connection to be plugged into the CD38A port. This port is either located in the electrical cabinet on the Main control module or behind the LCD of the operator interface. The FOCAS connection is configured via the control interface by pressing the SYSTEM button, then EMBEDD (SYSTEM / ETHPRM / EMBEDD in older models). From there, one can set the IP address and view the TCP port number (typically 8193).
Siemens
Many Siemens controllers support a data connection called OPC UA. In order to utilize this connection, an OPC UA license from Siemens is required. Some machines may be licensed already so it is important to check each machine and contact Siemens directly if licensing is required.
MTConnect
What is it?
MTConnect is a global standard of semantic vocabulary which when followed, allows manufacturing equipment to share data despite having different, proprietary operating systems. MTConnect is being used to integrate more than 50,000 devices by more than 300 manufacturers and integrators.
How Does It Work?
There are technically four components to each MTConnect instance although some of these components may be combined into a single unit or into the machine, depending upon the configuration. It works as follows:
- CNC machine sends data in its proprietary format to an MTConnect Adapter
- The Adapter (usually made by the CNC machine manufacturer) then translates the data and transmits it to the Agent (usually in an SHDR format)
- The MTConnect Agent then compiles the data and converts it into XML
- A client (Machine Monitoring System) can then query data from the Agent, receiving the most current, time stamped data.
Costs and Implementation
The MTConnect Adapter contains proprietary information and there is typically a cost to that component (although Okuma has begun including an Adapter free of charge with their machines at the time this article is being written). We suggest getting with your machine manufacturer or service provider to enquire about obtaining Adapter licenses.
MTConnect Agent software is free of charge and is available from GitHub or your service provider.
Best practices include the installation of the Adapter and Agent software on the same computer or controller that the machine uses if possible. This makes troubleshooting and future updates easier and more compartmentalized.
HAAS MDC
Note: All Haas Next Gen controls have a built-in MTConnect adapter on port 8082
The Haas MDC is a limited data connection, providing in-cycle status only. MDC is configured by pressing the SETTING button, and navigating to the Network tab. A wired connection is recommended. To configure a wired network connection, navigate to the Wired Connection tab, set Wired Network Enabled to On, Obtain Address Automatically to Off, and set the IP Address. Press F4 to apply the changes and verify the Status changes to UP. A configured wired connection is shown.
After the network is configured, the Machine Data Collection Port needs to be set. Press the SETTING button, navigate to the Settings tab and search for setting 143 by typing 143 and pressing F1. Set the port number to an unused port. A configured example of the settings menu is shown below. Note: Do not use ports 8082 and 9090 – 9999 because they are already used by the Haas CNC control for other purposes.
I/O Connections
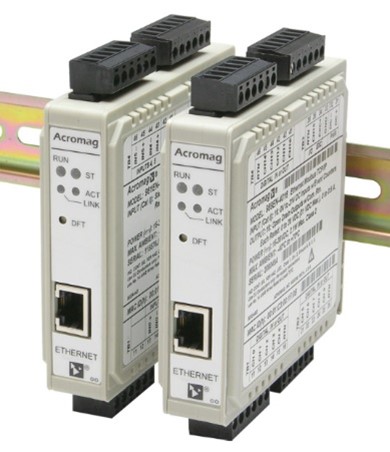
I/O connections work well and provide accurate data but provide less information than a true data connection as listed above. An ethernet or Wi-Fi device with multiple contacts is provided for connection to the machine. Connection points can be any combination of the following:
- Controller default output relays
- Programmable expansion relays
- Indicator lights
- Rotary dials
- Current flow detectors
- Etc.
Mapping software is used to convert the signal into a usable data point within the machine monitoring system.
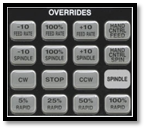
Note: Push style feedrate override buttons can’t interface using this method.
On / Off Monitoring
This is the least informative and therefore the easiest to configure method of monitoring a CNC machine. This type of monitoring should only be used if Data and I/O is not available on the machine. This type of monitoring monitors the current flow to the spindle. Care should be taken to avoid false reads when a machine is intentionally running the spindle when not working in order to keep the machine warmed up.
Can OEE Be Derived from Machine Monitoring Data?
OEE can and should be derived from the machine monitoring data, but one must take care to ensure the data points being brought together are from the same time period, machine, operations, etc.
OEE Explained
Overall Equipment Effectiveness (OEE – also called Operational Efficiency) is a metric used to show how efficiently machine equipment is running. The formula is
OEE = A x P x Q
A = Availability. It’s the actual uptime of the machine vs scheduled and is calculated as follows: Actual run time / Scheduled time. Example: the machine we scheduled for 8 hours but only ran for 6 hours. 6/8 = .75
P = Performance. It’s the actual performance vs. ideal performance and is calculated as follows: (Number of parts produced * ideal cycle time)/scheduled time. Example: 5 parts were produced, the ideal cycle time is 1 hour and 8 hours was scheduled. (5/1)/8 = .625
Q = Quality. The number of good parts vs parts produced during the time scheduled for A and P. Example. We produced 4 parts and they were all good parts. 4/4 = 1 or 100%.
In the examples above, we would plug the values in to get our result as a percentage.
OEE = .75 (A) x .625 (P) X 1 (Q) = 46.875%
OEE Data
Most machine monitoring systems can compile the A and P parameters of the calculation, but because quality is rarely quantified at the machine, Q data must either be input manually from an outside source or some sort of API mapping must be done to import the Quality data.
Summary
Machine monitoring is a tool which enables manufacturers to make informed decisions about shop floor optimizations, scheduling, expansion, and scheduling. Because of this and its relative low cost to implement, machine monitoring is likely to continue to grow in popularity.


